TensorFlow入门

目标

实现官方案例,训练一个神经网络模型,对运动鞋和衬衫等服装图像进行分类,数据集来自Fashion-MNIST 样本

本文环境为Python3 x64,windows系统

实现

一、使用前准备

1. 安装依赖

1
2
pip install numpy==1.18.5
pip install tensorflow==2.3.0

会自动安装相关依赖

Successfully installed tensorboard-2.8.0 tensorboard-data-server-0.6.1 tensorflow-2.3.0 tensorflow-estimator-2.3.0

2. 在项目中引用

1
2
3
4
5
6
7
# TensorFlow and tf.keras
import tensorflow as tf
from tensorflow import keras

# Helper libraries
import numpy as np
import matplotlib.pyplot as plt

如果需要在matplotlib显示中文,可以添加如下

1
2
3
# 解决中文乱码问题需要用到的
from matplotlib.font_manager import FontProperties
font_set = FontProperties(fname=r"C:\windows\fonts\simsun.ttc", size=12)

之后再需要显示中文的地方加上fontproperties=font_set参数

二、使用

1. 导入 Fashion MNIST 数据集

  • 直接从 TensorFlow 中导入和加载 Fashion MNIST 数据
1
2
fashion_mnist = keras.datasets.fashion_mnist
(train_images, train_labels), (test_images, test_labels) = fashion_mnist.load_data()
  • 定义类名,方便后边使用
1
2
class_names = ['T恤/上衣', '裤子', '套头衫', '连衣裙', '外套',
'凉鞋', '衬衫', '运动鞋', '包', '短靴']

2. 浏览数据

1
print(train_images.shape)

(60000, 28, 28)

可知train_images中有60000个28x28像素的图片

1
2
print(len(train_labels))
print(train_labels)

60000

[9 0 0 … 3 0 5]

可知train_labels是一个数组,由60000个0-9之间的数字组成

同理可知test_images中有10000个28x28像素的图片,test_labels是一个数组,由10000个0-9之间的数字组成

3. 预处理数据

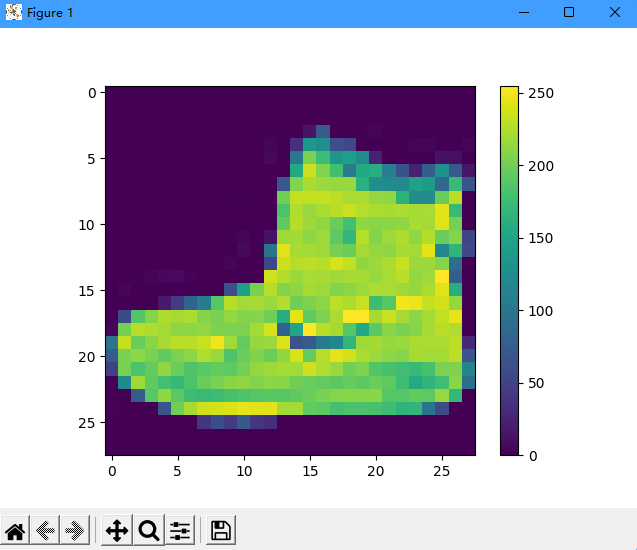
在训练网络之前,必须对数据进行预处理。如果您检查训练集中的第一个图像,您会看到像素值处于 0 到 255 之间

1
2
3
4
5
plt.figure()
plt.imshow(train_images[0])
plt.colorbar()
plt.grid(False)
plt.show()

将其除以 255,可使值范围在0-1之间

1
2
train_images = train_images / 255.0
test_images = test_images / 255.0

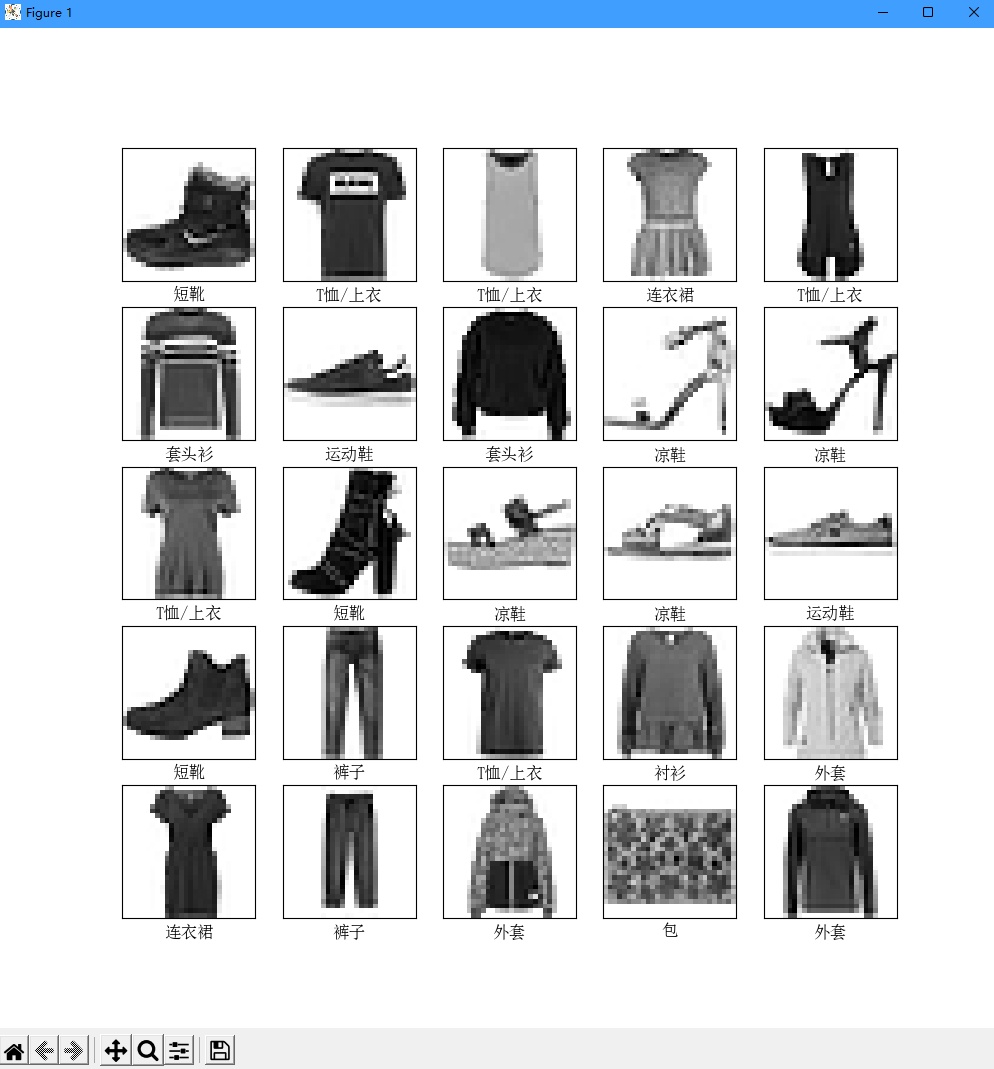
可通过以下方式验证

1
2
3
4
5
6
7
8
9
plt.figure(figsize=(10,10))
for i in range(25):
plt.subplot(5,5,i+1)
plt.xticks([])
plt.yticks([])
plt.grid(False)
plt.imshow(train_images[i], cmap=plt.cm.binary)
plt.xlabel(class_names[train_labels[i]], fontproperties=font_set)
plt.show()

完整代码

1
2
3
4
5
6
7
8
9
10
11
12
13
14
15
16
17
18
19
20
21
22
23
24
25
26
27
28
29
30
31
32
33
34
35
36
37
38
39
40
41
42
43
44
45
46
47
48
49
50
51
52
53
54
55
56
57
58
59
60
61
62
63
64
65
66
67
68
69
70
71
72
73
74
75
76
77
78
79
80
81
82
83
84
85
86
87
88
89
90
91
92
93
94
95
96
97
98
99
100
101
102
103
104
105
106
107
108
109
110
111
112
113
114
# TensorFlow and tf.keras
import tensorflow as tf
from tensorflow import keras

from matplotlib.font_manager import FontProperties
font_set = FontProperties(fname=r"C:\windows\fonts\simsun.ttc", size=12)

# Helper libraries
import numpy as np
import matplotlib.pyplot as plt

# 直接从 TensorFlow 中导入和加载 Fashion MNIST 数据
fashion_mnist = keras.datasets.fashion_mnist
(train_images, train_labels), (test_images, test_labels) = fashion_mnist.load_data()
# 定义类名,方便后边使用
class_names = ['T恤/上衣', '裤子', '套头衫', '连衣裙', '外套',
'凉鞋', '衬衫', '运动鞋', '包', '短靴']

# print(train_images.shape)
# print(len(train_labels))
# print(train_labels)

# plt.figure()
# plt.imshow(train_images[0])
# plt.colorbar()
# plt.grid(False)
# plt.show()

train_images = train_images / 255.0
test_images = test_images / 255.0

# plt.figure(figsize=(10,10))
# for i in range(25):
# plt.subplot(5,5,i+1)
# plt.xticks([])
# plt.yticks([])
# plt.grid(False)
# plt.imshow(train_images[i], cmap=plt.cm.binary)
# plt.xlabel(class_names[train_labels[i]], fontproperties=font_set)
# plt.show()

# 模型配置
model = keras.Sequential([
keras.layers.Flatten(input_shape=(28, 28)),
keras.layers.Dense(128, activation='relu'),
keras.layers.Dense(10)
])

model.compile(optimizer='adam',
loss=tf.keras.losses.SparseCategoricalCrossentropy(from_logits=True),
metrics=['accuracy'])

# 训练
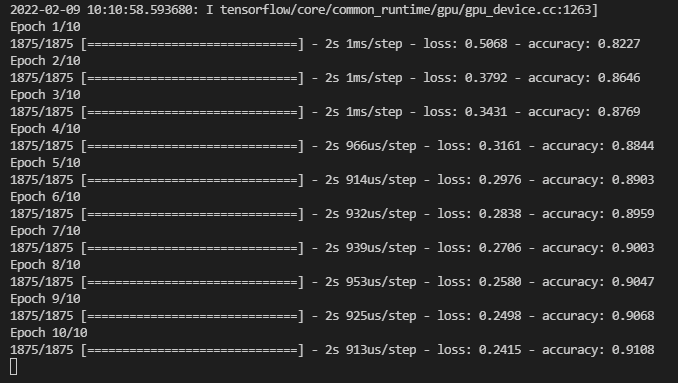
model.fit(train_images, train_labels, epochs=10)

# test_loss, test_acc = model.evaluate(test_images, test_labels, verbose=2)

# print('\nTest accuracy:', test_acc)

probability_model = tf.keras.Sequential([model,
tf.keras.layers.Softmax()])

predictions = probability_model.predict(test_images)

# print(predictions[0])

# 图片与标签
def plot_image(i, predictions_array, true_label, img):
predictions_array, true_label, img = predictions_array, true_label[i], img[i]
plt.grid(False)
plt.xticks([])
plt.yticks([])

plt.imshow(img, cmap=plt.cm.binary)

predicted_label = np.argmax(predictions_array)
if predicted_label == true_label:
color = 'blue'
else:
color = 'red'

plt.xlabel("{} {:2.0f}% ({})".format(class_names[predicted_label],
100*np.max(predictions_array),
class_names[true_label]),
color=color,
fontproperties=font_set)

# 表
def plot_value_array(i, predictions_array, true_label):
predictions_array, true_label = predictions_array, true_label[i]
plt.grid(False)
plt.xticks(range(10))
plt.yticks([])
thisplot = plt.bar(range(10), predictions_array, color="#777777")
plt.ylim([0, 1])
predicted_label = np.argmax(predictions_array)

thisplot[predicted_label].set_color('red')
thisplot[true_label].set_color('blue')


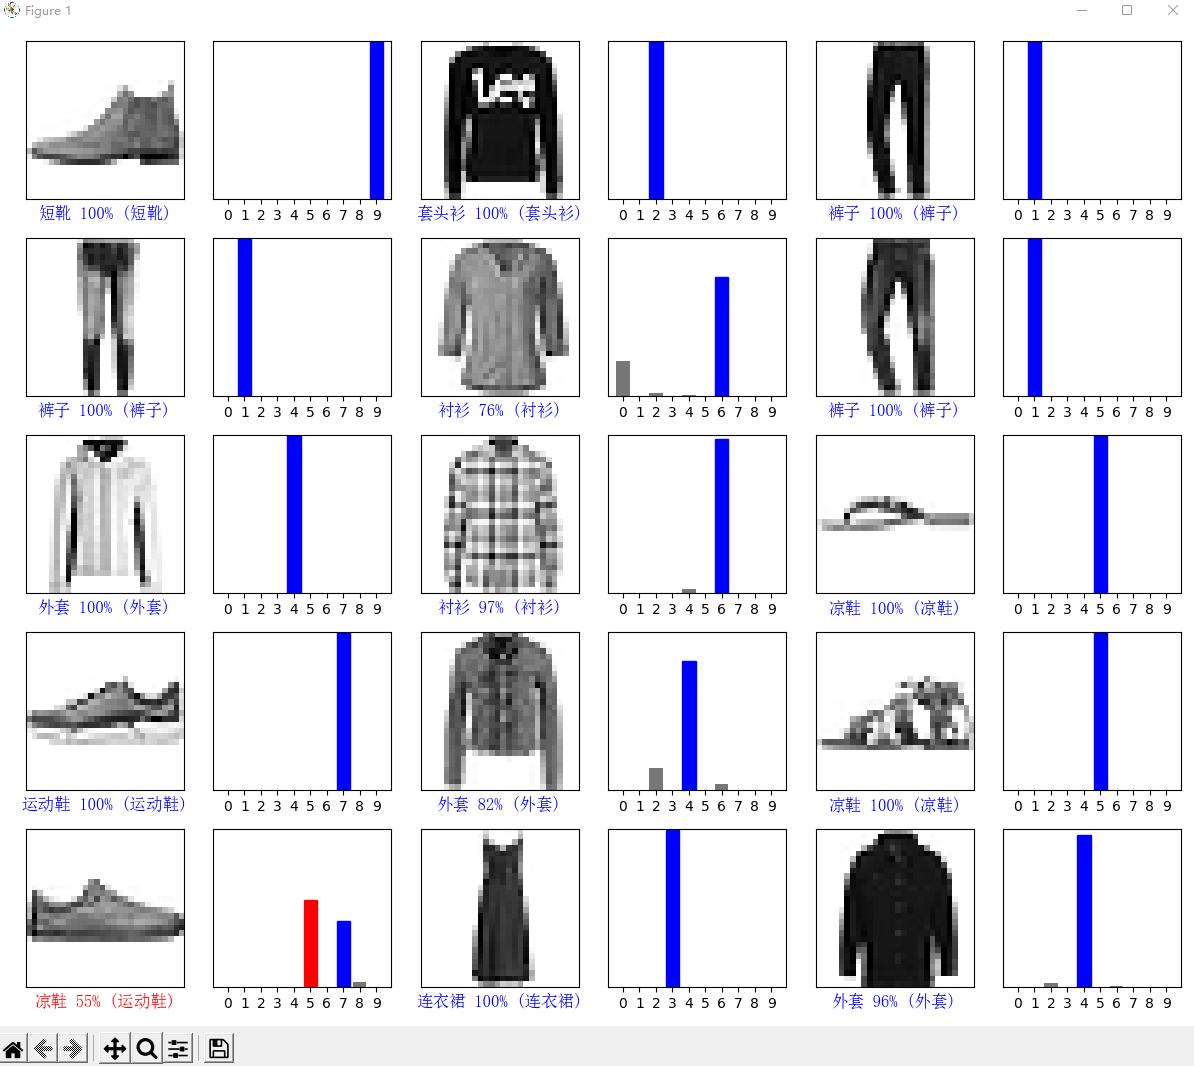
# Plot the first X test images, their predicted labels, and the true labels.
# Color correct predictions in blue and incorrect predictions in red.
num_rows = 5
num_cols = 3
num_images = num_rows*num_cols
plt.figure(figsize=(2*2*num_cols, 2*num_rows))
for i in range(num_images):
plt.subplot(num_rows, 2*num_cols, 2*i+1)
plot_image(i, predictions[i], test_labels, test_images)
plt.subplot(num_rows, 2*num_cols, 2*i+2)
plot_value_array(i, predictions[i], test_labels)
plt.tight_layout()
plt.show()

训练结果

预测结果


TensorFlow入门
https://blog.ctftools.com/2022/02/newpost-33/
作者
Dr3@m
发布于
2022年2月8日
许可协议